Real time graphs
Grafana
Grafana is an open source analytics and monitoring solution and may be used to view various BEAM metrics in real time during BEAM execution. It is a tool to display data from data source. In our case the data source is InfluxDB .
Docker installation and configuration
There is a docker image with Grafana and InfluxDB preconfigured to work with BEAM, thus docker needs installed in order to use Grafana.
Ubuntu Linux users
Requirements
- 64-bit version of one of these Ubuntu versions: Disco 19.04, Cosmic 18.10, Bionic 18.04 (LTS), Xenial 16.04 (LTS)
Installation
There is an official installation guide for Ubuntu Linux users and a Post-installation guide for Linux with optional procedures for configuring Linux hosts to work better with Docker for non-root users.
Otherwise use these commands:
sudo apt-get update
sudo apt-get install docker-ce docker-ce-cli containerd.io docker-compose
Mac users
Requirements
- Mac hardware must be a 2010 or newer model
- macOS must be version 10.13 or newer
- VirtualBox prior to version 4.3.30 must not be installed as it is not compatible with Docker Desktop.
Installation
There is an official installation guide for Mac users.
Otherwise download and install Docker CE for Mac (Stable).
Windows users
Requirements
- Windows 10 64-bit (Pro, Enterprise, or Education (Build 15063 or later)) - these are pre-req for Docker Desktop.
- Enable Hyper-V & Containers Windows features (usually done by docker installer).
- BIOS-level hardware virtualization support must be enabled in the BIOS settings (here’s a guide on how to do it)
Installation
There is an official installation guide for Windows users.
Otherwise download and install Docker CE for Windows (Stable).
Virtualization
Windows users should also check if virtualization is enabled in firmware. To do so, check the Performance tab on the Task Manager:
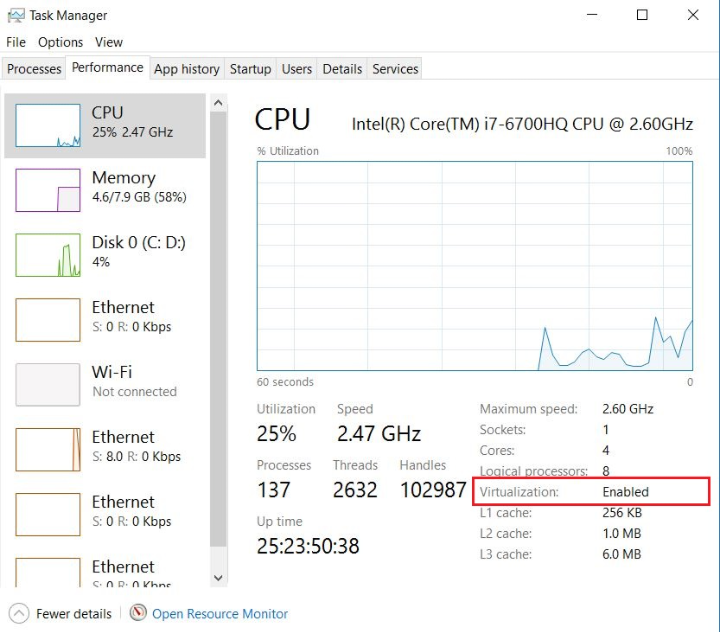
check if virtualization is enabled
If not, virtualization should be enabled in BIOS:
- Reboot your computer
- Right when the computer is coming up from the black screen, press Delete, Esc, F1, F2, or F4. Each computer manufacturer uses a different key but it may show a brief message at boot telling you which one to press. If you miss it the first time, reboot and try again. It helps to tap the key about twice a second when the computer is coming up.
- In the BIOS settings, find the configuration items related to the CPU. These can be found under the headings Processor, Chipset, or Northbridge.
- Enable virtualization; the setting may be called VT-x, AMD-V, SVM, or Vanderpool. Enable Intel VT-d or AMD IOMMU if options are available.
- Save your changes and reboot.
Another instruction with examples for different computer manufacturers can be found here.
Verify docker installation
Verify that docker is installed correctly by typing in a terminal or in a command window:
docker run hello-world
Output should contain:
Hello from Docker!
This message shows that your installation appears to be working correctly.
Control Grafana using gradle commands
Start Grafana
To run Grafana one should use gradle command grafanaStart. The command will start the Grafana and InfluxDB docker container,
configure them and print URLs to Grafana dashboards after the docker image is running.
./gradlew grafanaStart
After that command execution one may run BEAM multiple times, all data will be stored in the InfluxDB database.
Stop Grafana
When Grafana is stopped, all collected InfluxDB data will be stored in snapshots on the file system. The snapshot will be used next time Grafana starts, thus data won’t be lost.
To stop Grafana one should use the gradle command grafanaStop.
./gradlew grafanaStop
Clear collected data
To clear all the BEAM run data collected by InfluxDB one should use the gradle command grafanaClearData.
This command should only be used after Grafana has stopped.
./gradlew grafanaClearData
Working with Grafana graphs
There are different views which are called dashboards that allow you to see BEAM results in different ways:
- The Global view plots output metrics from the simulation in an iteration-by-iteration format. I.e. this view is good for seeing how the system evolves over the iterations as user equilibrium is established.
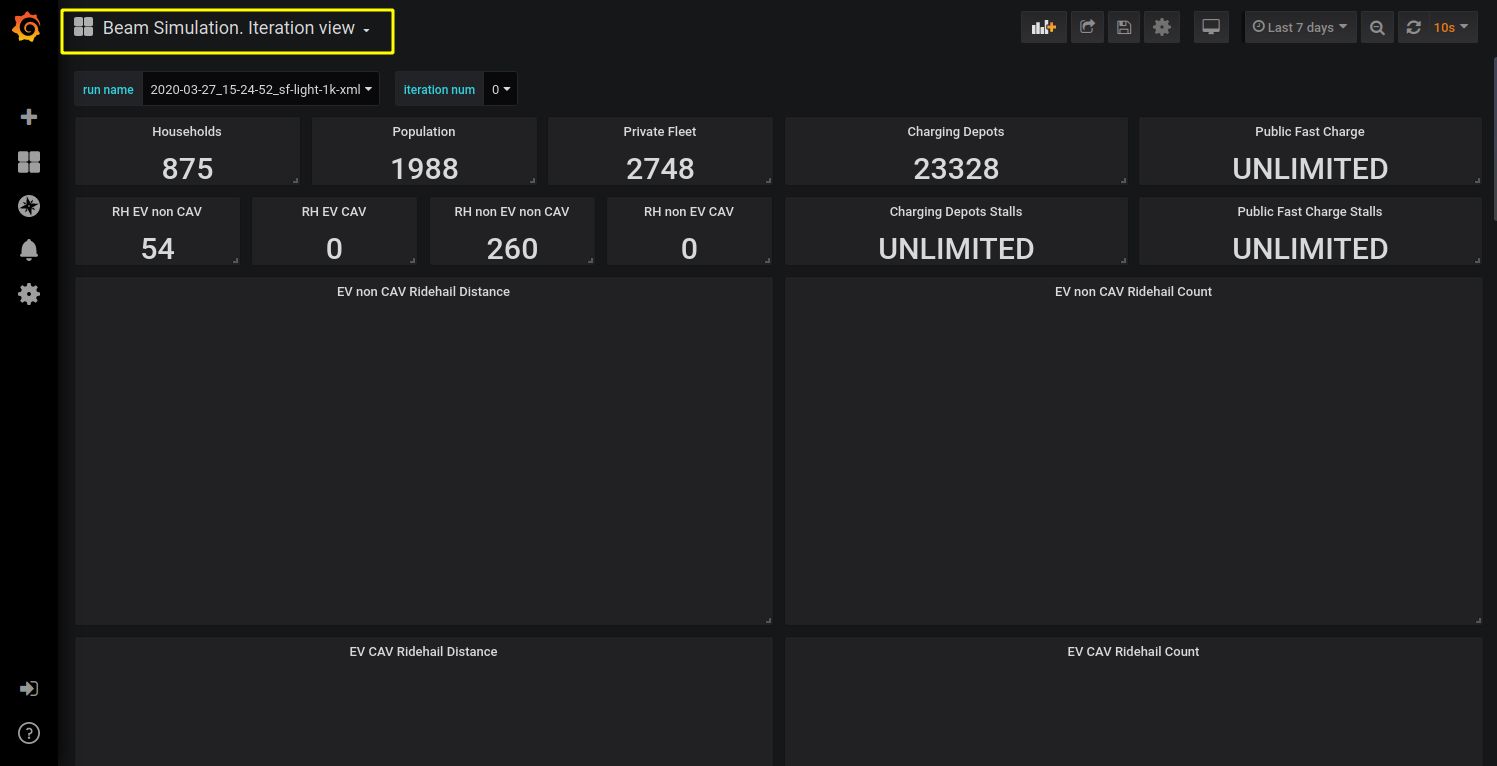
- The Iteration view shows the output of a single iteration within BEAM and plots metrics on an hourly time scale, this is useful for seeing granular dynamics like the use of charging infrastructure over time.
- In both of the previous views, only one BEAM run may be viewed at a time but there are also Global view comparison and Iteration view comparison which allow you to view two BEAM runs at the same time or one BEAM run but with different iterations.
- The Iteration MAP view allows you to see various BEAM metrics displayed on a map with the ability to choose any combination of available metrics, hour and iteration to display.
Select BEAM run
To select which BEAM run graphs should be displayed one can use the switch run name. A BEAM run name has the format: date_time_simulation-name
where date and time are local date and time for the pc where BEAM is running, and the simulation name is taken from the beam.agentsim.simulationName
config value. The BEAM run list containing the run name switch is updated after a page refresh. So make sure to refresh your browser after
a new BEAM run is started and output from the simulation have begun to accumulate. If there are no active BEAM runs in the local history then one will see no choice for ‘run_name’:
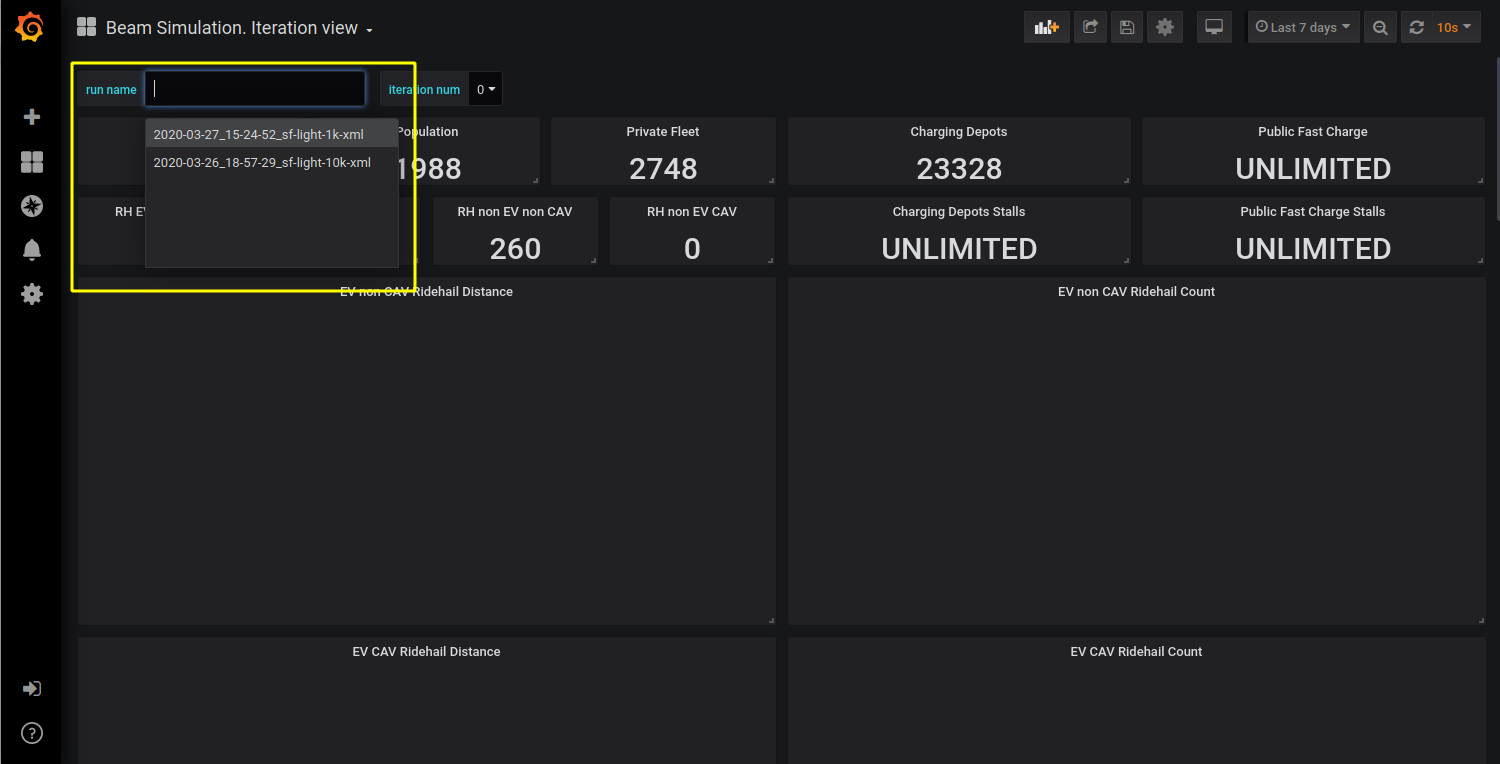
BEAM run name switch
Disable and enable data traces
It is possible to disable and enable some of the value traces on a graph by clicking on the name of a trace.
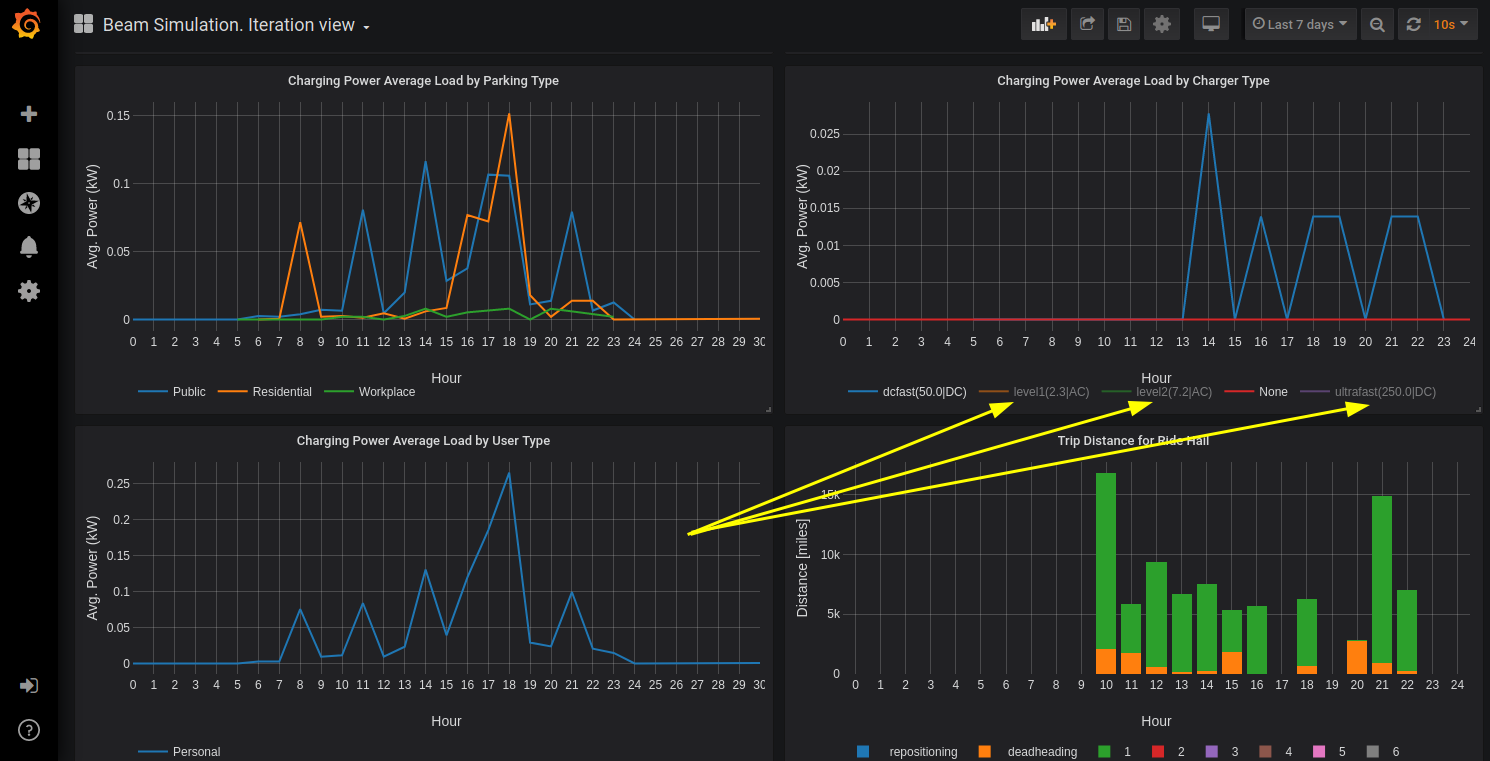
enable | disable traces
Select BEAM iteration
On Iteration View it is possible to select the iteration to see through the ‘iteration_num’ switch. Iteration number switch will update after a page refresh.
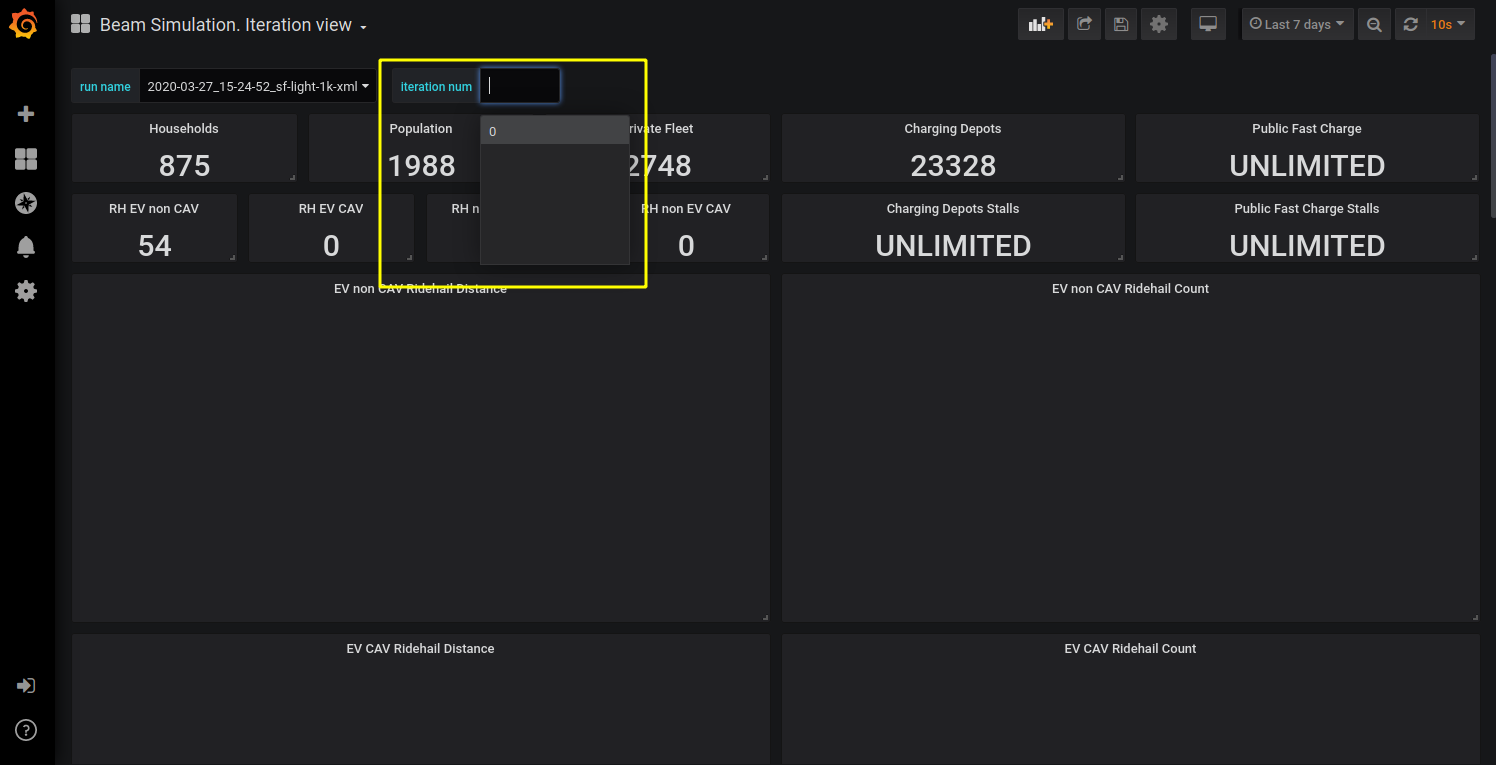
BEAM iteration switch
Select data update frequency
There is a switch to choose how frequently grafana should gather data from the output DB. The switch is in the top right corner of all dashboards. In the example below the switch is set to update every 10 seconds. Also, there is a refresh button near the switch, this button does not refresh the entire page, run name or iteration num switch, only the graphs.
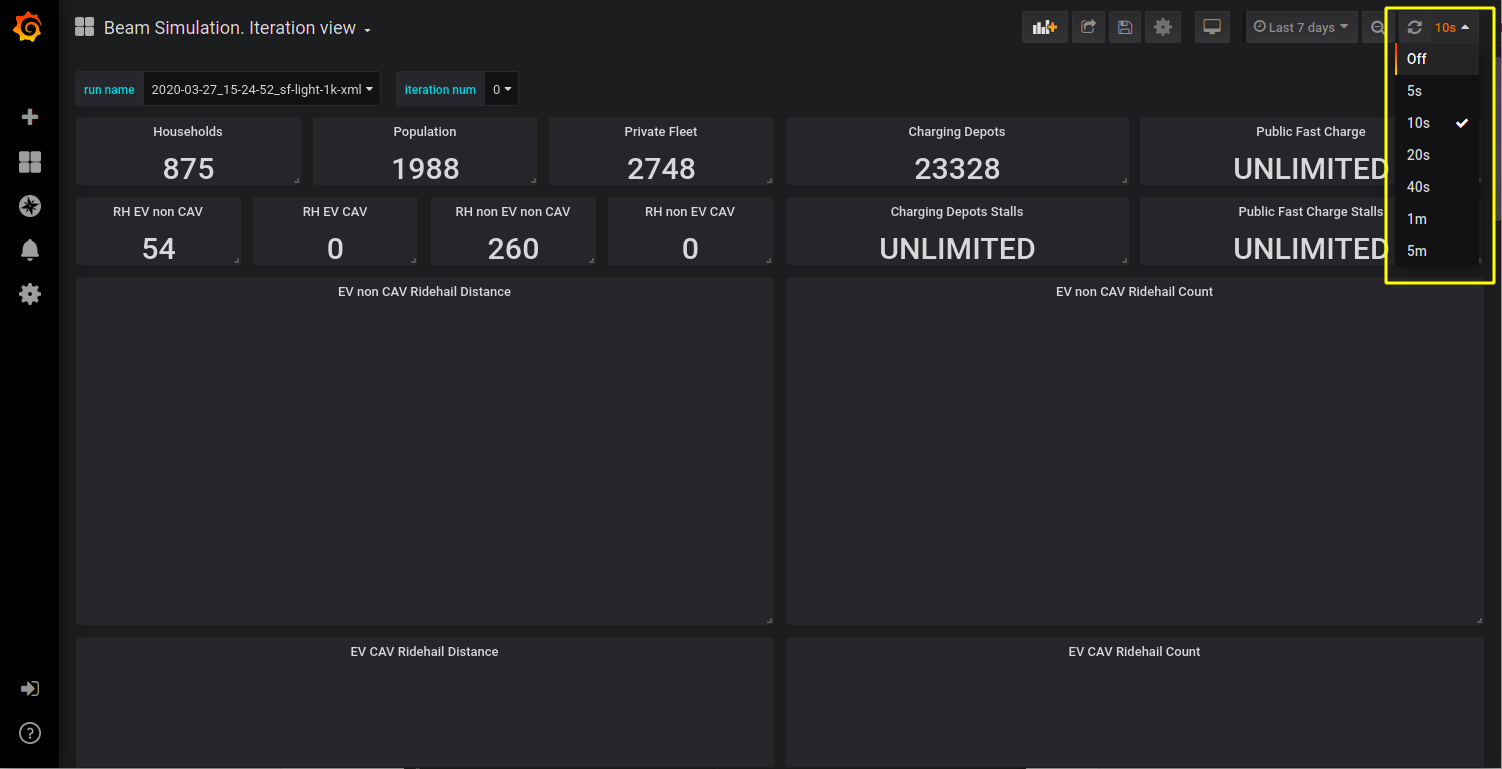
shoose graphs update frequency
Iteration Map View
On the Iteration Map View oone may choose which data trace are displayed as bar graphs (1), which data traces are displayed on a map (2) and for what hour data traces are displayed on a map (3). Map is functional too, so, one may zoom in and out and move around with mouse controls.
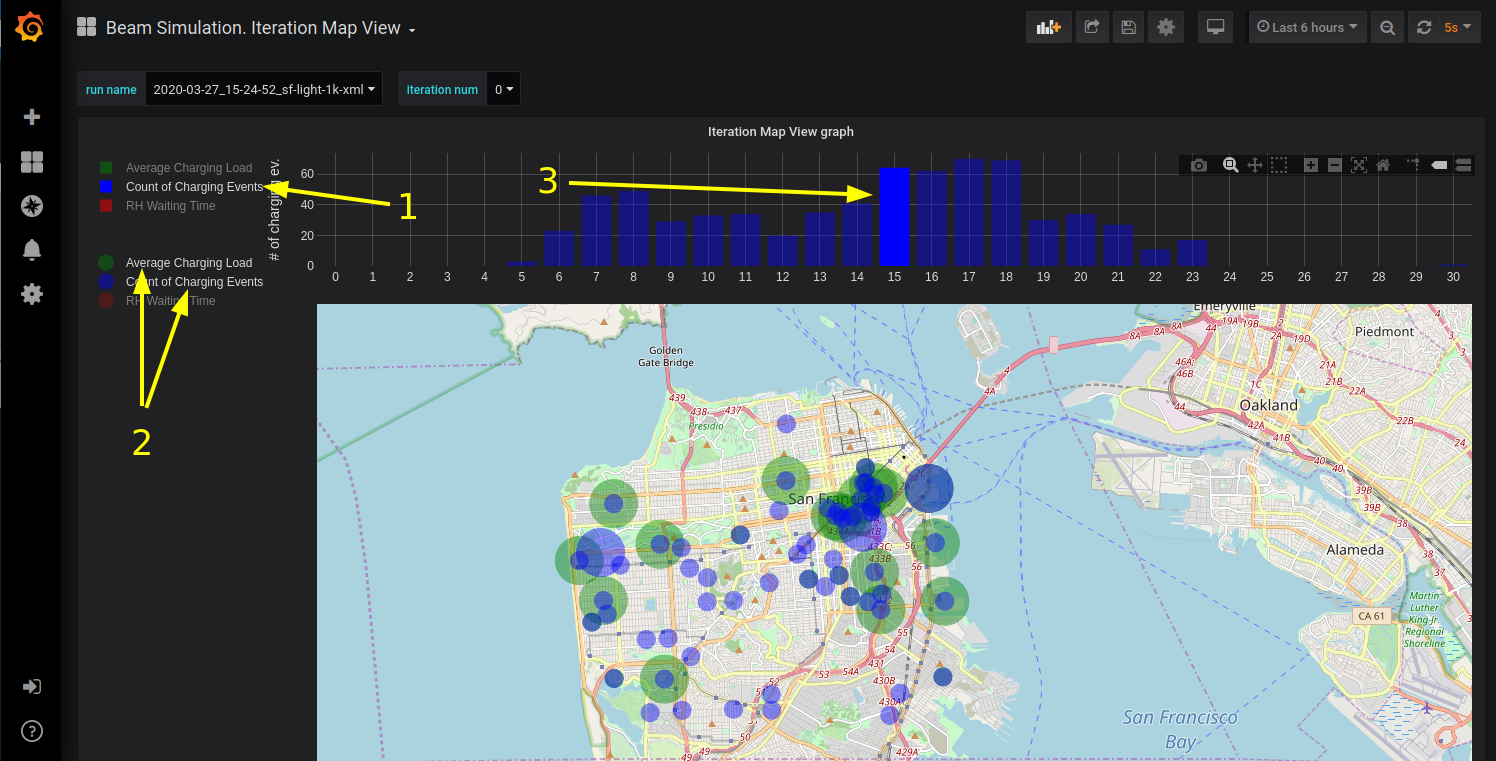
example of map view
Configure BEAM metrics in Grafana
Existing metrics
To configure which metrics will be written one should use BEAM configuration files.
There is a configuration entry beam.sim.metric.collector.metrics which contains the names of enabled metrics
and thus controls which metrics will be written during BEAM execution.
By default metrics which do not affect performance are enabled globally in “test/input/common/metrics.conf” file.
To configure metrics for a specific BEAM configuration one may add the configuration entry in that specific configuration file.
Metrics description:
Metrics which contain a run name and an iteration number and are necessary for displaying any metric:
beam-run,
beam-iteration
Metrics which contain a single number with a count of households, population size, charging stalls count e.t.c:
beam-run-households,
beam-run-population-size,
beam-run-private-fleet-size,
beam-run-charging-depots-cnt,
beam-run-charging-depots-stalls-cnt,
beam-run-public-fast-charge-cnt,
beam-run-public-fast-charge-stalls-cnt
Metrics which contain a single number with a count of different types of ride hail vehicles:
beam-run-RH-ev-cav,
beam-run-RH-non-ev-cav,
beam-run-RH-ev-non-cav,
beam-run-RH-non-ev-non-cav
Various metrics for all vehicles/persons:
parking,
chargingPower,
mode-choices,
average-travel-time
Various metrics for ride hail
ride-hail-waiting-time,
ride-hail-waiting-time-map,
ride-hail-trip-distance,
ride-hail-inquiry-served (graph is not added to a grafana dashboard),
ride-hail-allocation-reserved (graph is not added to a grafana dashboard)
Metrics which impact performance
Ride hail EV (electric vehicle), CAV (connected and automated vehicle) metrics:
rh-ev-cav-count,
rh-ev-cav-distance,
rh-ev-nocav-count,
rh-ev-nocav-distance,
rh-noev-cav-count,
rh-noev-cav-distance,
rh-noev-nocav-count,
rh-noev-nocav-distance
New metrics
In order to write and display a new metric one should do two things:
- write metric into metric storage
- display metric on a grafana dashboard.
How to write a new metric into storage
To write a new metric into storage during a BEAM execution one needs to use an appropriate method from trait SimulationMetricCollector.
There are methods to write iteration-level metrics with hours on X axis or to be displayed on a map
and methods to write global-level metrics with iteration on X axis. There is also a method to check if a metric is enabled.
Troubleshooting
Error
for docker-influxdb-grafana Cannot create container for service docker-influxdb-grafana: Conflict. The container name “/docker-influxdb-grafana” is already in use by container “<CONTAINER ID>”. You have to remove (or rename) that container to be able to reuse that name.
This error means that one already has a container with the name ‘docker-influxdb-grafana’ in docker. To handle that one may remove that container:
docker container stop docker-influxdb-grafana
docker rm docker-influxdb-grafana
